
The Easter Story in a Graph
Charmaine is forever telling Your Business Professor to write an outline for plotting a story.
A good tale has a problem, a solution, and a result. Kurt Vonnegut does a chalkboard talk and graphs various story lines in this short video:
A story could be described with a Headline and a short two or three word descriptor; a simple Plot Line and a Happy Ending.
The Easter Story has a simple diagram:
Y axis — emotion and the X axis –time
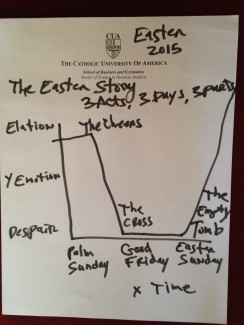
I. Palm Sunday
The Cheers
Jesus enters Jerusalem to celebrate Passover.
He is greeted with adoring crowds waving palm branches.
II. Good Friday
The Cross
Jesus is executed as ‘King of the Jews’ by
the Romans. The Religious of the day
claim he is guilty of blasphemy.
III. Easter Sunday
The Empty Tomb
On the third day Jesus is raised from
the dead by the power of the Holy Spirit.
He is risen.
The plot line is simple. The story can be life changing.
Recent Comments